Read both axis labels, units and tick intervals first. Use a point's height to answer questions about a value, and change in the vertical quantity divided by change in the horizontal quantity to answer questions about average rate. Keep conclusions within the data and the assumptions stated in the question.
Start with the labels, then the question
During science review, it is tempting to pick the tallest point whenever a question asks for the “greatest” something. But greatest temperature and greatest rate of temperature increase ask for different information.
Before calculating, read the title, both axis labels and their units. Check how much each tick represents, whether an axis has a break, and which line a legend identifies. Then underline the quantity and interval the question asks about.
The labels also determine what a slope means. For example, a position–time slope describes velocity. A temperature–time slope has temperature-change units per unit of time. OpenStax explains how the axes give a slope its physical meaning.
Try this original temperature graph
The values below are fictional practice data created by PasadoPH, not results from a real experiment or an official exam. For this exercise, straight segments connect consecutive points. Treat those segments as a simple model between the listed readings.
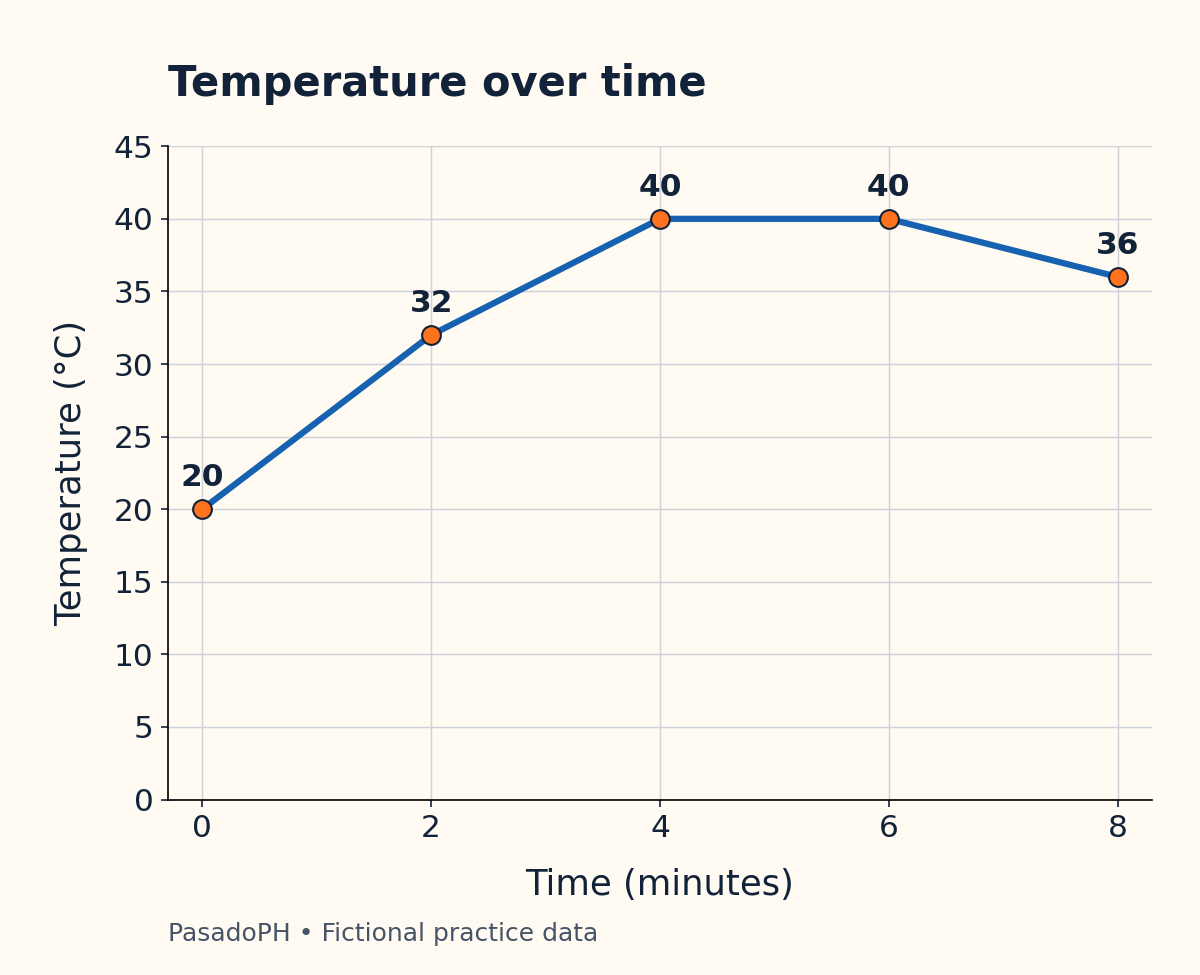
The same data are available in this table:
| Time (minutes) | Temperature (°C) |
|---|---|
| 0 | 20 |
| 2 | 32 |
| 4 | 40 |
| 6 | 40 |
| 8 | 36 |
The horizontal ticks increase by 2 minutes; the vertical ticks increase by 5°C. One grid interval therefore has a different meaning on each axis.
Try answering these before reading the explanations:
- What temperature is recorded at 2 minutes?
- Which two-minute interval has the fastest temperature rise?
- What is the average rate of change over all 8 minutes?
- Does the flat segment prove that the substance is boiling?
1. A value question needs one point
At 2 minutes, move vertically from the horizontal axis to the plotted point, then read its height: 32°C. The answer needs temperature units, not minutes or °C per minute.
The highest recorded temperature is 40°C, at both 4 and 6 minutes. The connecting segment also stays at 40°C in our model. Neither statement answers how quickly the temperature rose to that level.
2. A rate question needs an interval
For each interval, subtract the starting temperature from the ending temperature and divide by elapsed time. This is the average-rate calculation described in OpenStax’s guide to rates of change.
Keep the subtraction order consistent in the numerator and denominator.
| Interval (minutes) | Temperature change (°C) | Average rate (°C/min) |
|---|---|---|
| 0–2 | 32 − 20 = 12 | 12 ÷ 2 = 6 |
| 2–4 | 40 − 32 = 8 | 8 ÷ 2 = 4 |
| 4–6 | 40 − 40 = 0 | 0 ÷ 2 = 0 |
| 6–8 | 36 − 40 = −4 | −4 ÷ 2 = −2 |
The fastest rise is from 0 to 2 minutes: 6°C/min. At the highest part of the graph, from 4 to 6 minutes, the model’s temperature is not rising at all.
The last interval’s negative sign means the temperature decreases as time advances. It does not mean that the temperature itself is negative: both endpoint readings are above 0°C.
These intervals are equally long, so comparing their temperature changes happens to give the same ranking. With unequal intervals, calculate each rate before comparing them. A 12°C rise over 6 minutes is only 2°C/min, smaller than an 8°C rise over 2 minutes.
3. Use the endpoints of the requested interval
Over the full 8 minutes, the temperature changes from 20°C to 36°C:
The overall average rate is 2°C/min. This does not say that every minute had a 2°C rise. The table shows rising, flat and falling portions within the same period.
Do not add the absolute sizes of all temperature changes here. That would count the final decrease as another increase and answer a different question.
4. Separate what is shown from what is assumed
The flat segment supports “the plotted model stays at 40°C from 4 to 6 minutes.” It does not establish boiling. The exercise does not identify a substance, pressure or experimental conditions.
There is another limit: equal readings at two times do not, by themselves, prove that a real temperature stayed constant between them. In this exercise, constancy between 4 and 6 minutes follows from the explicitly supplied straight-line model.
Use the same distinction for estimates. At 3 minutes, halfway along the segment from 32°C to 40°C, the model gives 36°C. Label it an estimate between readings. Do not invent a ninth-minute measurement by extending the final segment unless a question explicitly asks for that assumption.
A check to use on your next practice question
Before selecting an answer, ask:
- Quantity: Am I finding a value, a change, a rate or a possible explanation?
- Scale: What does each tick mean, and have I used the labelled units?
- Interval: Did I choose the exact start and end requested?
- Evidence: Is this a recorded value, a model-based estimate or an unsupported claim?
If you chose 4–6 minutes as the fastest rise, record “used height instead of slope” in your entrance exam mistake log. Then cover the worked table and recalculate all four rates. For more practice separating evidence from added assumptions, try the inference and assumption exercise.
Bring this check to your next science review in the free PasadoPH practice diagnostic. Review the explanation for a missed item and name the exact reading or calculation that changed your answer.
Common questions
Does a higher point mean a faster rate of change?
No. Height gives the vertical value; rate compares changes in both coordinates. In this exercise, the highest temperature is 40°C, but the fastest rise occurs earlier, from 0 to 2 minutes.
What does a flat line mean on a science graph?
The vertical quantity is constant along that segment of the plotted model. Here, a flat temperature line means a temperature of 40°C from 4 to 6 minutes. It does not identify the substance or explain why the temperature is constant.
Can I read a value between two recorded points?
You can estimate it if the question supplies a model or allows interpolation. On the straight segment between 2 and 4 minutes, the estimated temperature at 3 minutes is 36°C. That is a model-based estimate, not an additional recorded measurement.
Sources & further reading
Sources checked for this guide on November 13, 2026. Admissions requirements can change; confirm your application cycle with the university.
Put one idea into practice.
Try a free diagnostic, review your answers, and choose your next topic. No card required.
Try free practice